Data, Signs and Datascience

#Covid19 gives a good perspective around Data and Signs and data science.
Note: When I refer thoughts about other people in this article, I am neither concurring nor am I disagreeing with them.
Often there is data. Often there are signs. Looking into data can be somewhat challenging.
For example, some people point out that Indians seem to have higher immunity against #coronavirus, hence we do not need to worry much. Many people would agree.
Some people, however, maintain that we need more data to come to this conclusion. As data from Italy, China, and the USA may have been only captured after Corona had spread there rampantly. Also, there has been a strict lockdown in India.
And then there are signs. One source of those signs is news. News is on the internet and social media.
R0 Factor, Case Fatality Rate, Infection Fatality Rate, Deaths Per Million, Tests Per Million, Tests per Case, Tests Per Fatality, Asymptomatic Rate, Average Date for First Symptom are all data. If available and reliable, you can rely on them and understand the exact situation.
However, data may not be reliable. And you never know if the data is reliable or not until you have a good amount of data. So you rely on signs and data...
News related to Delhi may have signs about the quality of data and maybe more than enough perspective about the real situation. Certainly, it may be shedding light on action items needed to be followed up to understand the true picture.
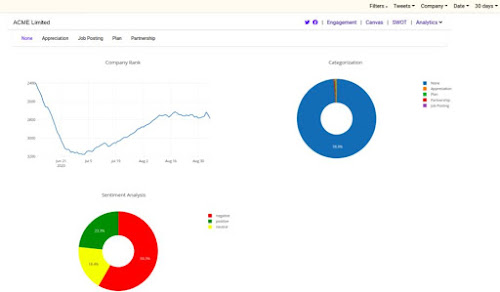
At Hobbiate, we track news to create signs that are valuable for your business. These signs shed light on your business strategy and company fundamentals. Some of these signs can paint a clearer picture of the true state of your industry than well-established market studies.
Comments
Post a Comment